 This time our blogpost will demonstrate a pretty nice report (VT at 6/54) our sandbox VxStream generated for an Angler related artifact that is classified as Rioselx.B by ESET (Baidu seems to have adopted the same name for some odd reason). Artifact name found in the context: Angler_5_770_0.bin_
Walking through the report
Note: if you want to follow our analysis in a second screen, scroll to the bottom for links.
What we like to do when looking at a report first is to start in a top-down approach, i.e. we start looking at the malicious signatures first. We quickly understand how the malware propagates:

... using the known QueueApcThread method.
We understand that it tries to fingerprint the system, lowers the security and tries to avoid being deleted through a rollback (disabling auto-update, disabling system restore):
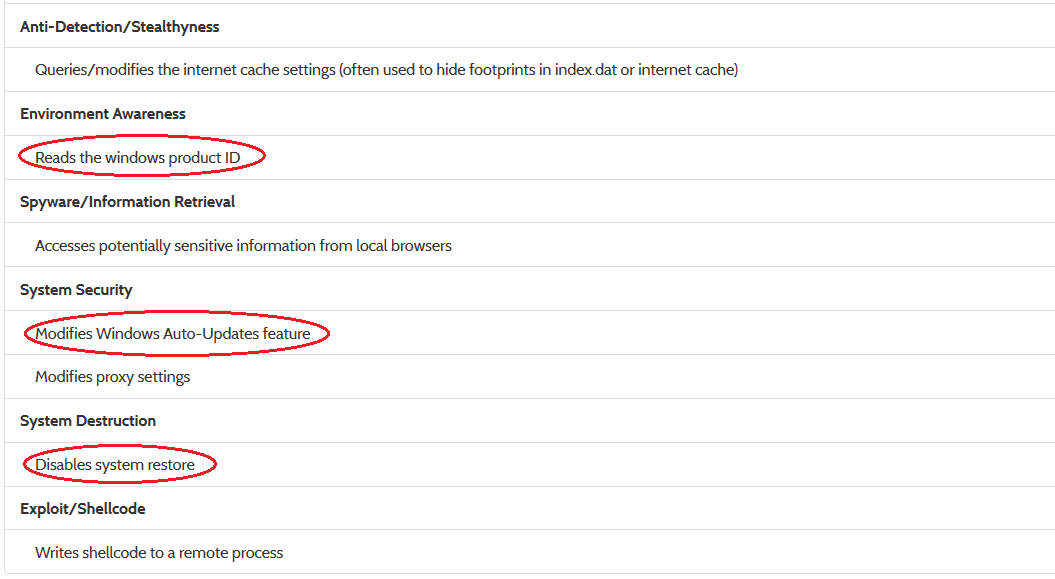
Now, of course, it depends on whether we are interested in simply understand that this is something we don't want to execute (in that case, we are done already), but extract indicators that we could use to feed into external systems, update security rules or generate signatures. In the latter case, the 'Writes shellcode to a remote process' seems promising.
Taking a look at the process tree (scroll down to 'Hybrid Analysis' on the right-side menu), we identify that only one process contains Stream or Shellcode Stream (disassembly listings) data:

Taking us to the next screen:

Here we marked a possible unique string identifier for this sample that could be used for YARA signatures:'@grcuk24/ghn' --- a brief query on our favorite DBs might confirm this.
Taking a look at the network traffic gives a good overview of domains/IPs you might want to blacklist. As they have only been seen in the overall webservice network traffic analysis 2 times, it is another indicator that we are not looking at 'white-noise' traffic.

If we scroll beyond the network section, we find the Strings tab. Hit the 'Details' button to see extended information on the encoding (Ansi/Unicode) and where the string was obtained from (e.g. a runtime API parameter, binary scan, memory dump):

In the 'All Strings' tab relatively far at the top we find two interesting strings that might be an obfuscated IP address. At least the string "89, 143, 187, 66" (which looks oddly much like an IP address, if you substitute the ", " with a "." dot character). It seems to resolve to Slovenia now and shows no malicious context on VirusTotal.
Checking out the 'Dropped Files' section of the kernelmode monitor report, we can detect additional artifacts being dropped that are also marked as malicious on VirusTotal as 'Chgt.O' (again: hit the 'Details' button to see the hash values for dropped files).

Note: all dropped files are checked against VirusTotal
More PE fun
If you scroll back to the 'File Details' tab and click on the 'Visualization (PortEx)' link, that takes us to a PE Layout visualization that is often overlooked. This is actually also a nice way to detect some interesting and malicious code locations.

The 'PE Layout' screen is a split-screen. On the left side is the 'entropy' of the PE file (i.e. the darker the spots, the higher the entropy; the higher the entropy, the more random the bytes in the sequence are; the higher the randomness, the more probable is the presence of packed/compressed data). The right hand side shows the general PE layout (see the legend on the very right), the entrypoint is marked with a small red dot, the import section in purple/pink, the resource section in green. We've highlighted the packed regions: what's suspicious is that there seems to be packed code following the entrypoint, between the import/resource section and as a possible overlay at the very end beyond the resource section. Of course, only a manual analysis can give more insights into these areas, but that is beyond the scope of the report.
Final Words
With this blogpost we hopefully gave more insights into how one can go about reading a report. Of course, there is a lot more you could do (like download and analyze the PCAP file, etc.), but we covered the basics. The standalone version comes with XML reports, an API and many other things that are more suitable for an integration of the sandbox in larger automated systems (more information).
Here is a link to the sample (also available at the top of the report). Please do try it on your favorite sandbox/security solution and we'd be happy to get some feedback at info@payload-security.com on how your experience was.
References
Here's the report on Windows 7 32-bit using our usermode technology: Click
This is the report on Windows 7 32-bit using our kernelmode technology: Click
Both
of the reports are pretty much identical, which is a good indicator as
to how strong the usermode anti-detection technology is, because the
kernelmode monitor is far less prune to being detected (as the malware
process remains untampered).